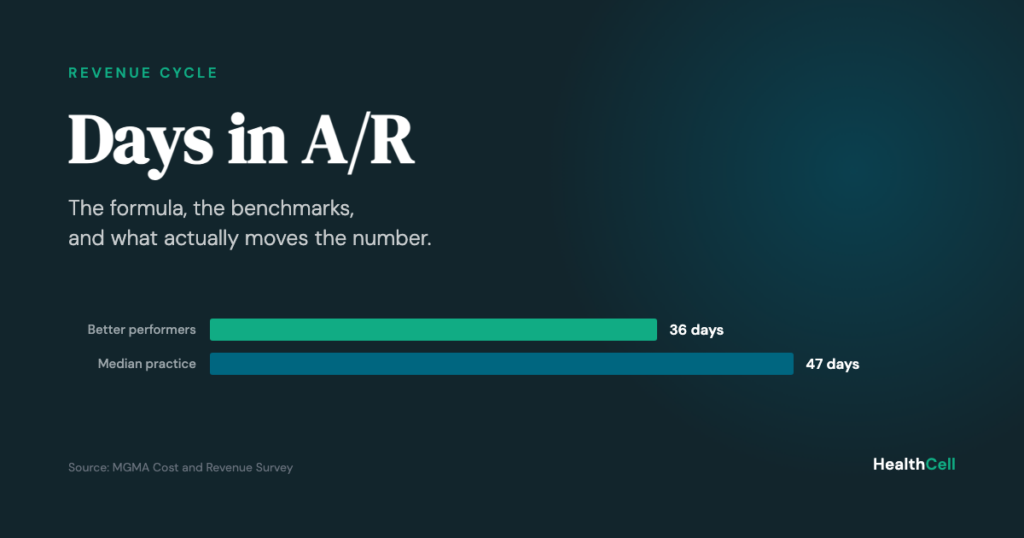
There’s an eleven-day gap sitting between the average medical practice and the ones that collect well, and most practices have no idea which side of it they’re on.
MGMA’s 2024 Cost and Revenue Survey puts the median practice at 47 days in accounts receivable. Better-performing practices sit at 36. On a practice billing $3 million a year in gross charges, that gap represents roughly $90,000 in revenue you’ve already earned, sitting in a worklist instead of your bank account.
Days in A/R is the metric that surfaces this. It’s also the metric most practices calculate with the wrong formula. Here’s how to get the number right, what to compare it against, and what actually moves it.
Key takeaways
- Days in A/R = total accounts receivable divided by average daily charges (gross charges over the last 90 days, divided by 90).
- MGMA’s 2024 survey puts the median practice at 47 days and better performers at 36. HFMA’s target range is 30 to 40 days.
- The finance formula you’ll find on most search results uses net revenue instead of gross charges. It flatters your number and hides the problem.
- Rising denials are the main reason the number drifts upward. Initial denial rates reached 11.8% in 2024, up from 10.2%.
What is days in accounts receivable?
Days in A/R measures the average number of days between entering a charge and collecting payment for it. MGMA’s 2024 Cost and Revenue Survey reports a median of 47 days across physician practices, with better-performing practices at 36 days. It’s the clearest single indicator of whether your revenue cycle is working.
The metric matters more than the raw dollar figure sitting in your A/R. A growing practice will naturally carry more receivables than a shrinking one. Days in A/R corrects for that by expressing your receivables as a function of how fast you’re billing, which makes it comparable across time and against other practices.
Accounts receivable in medical billing covers everything you’ve billed but haven’t collected: claims sitting with payers, balances waiting on patients, and anything caught in appeal. Practices track it in aging buckets, and where your dollars sit in those buckets tells you almost as much as the headline number.
Better-performing practices keep more than 70% of their receivables in the under-30-day bucket, with only 8.1% aging past 120 days. HFMA recommends keeping A/R over 90 days below 10% of your total. If your 90-plus bucket is climbing while your headline number looks stable, you have a problem that’s about to show up.
What is the days in A/R formula?
Days in A/R = total accounts receivable ÷ average daily charges, where average daily charges equals your gross charges over the last 90 days divided by 90. This is the convention MGMA and HFMA use for physician practices, and it’s the one your benchmarks assume.
Two things trip practices up here. The first is the 90-day window. A single month can swing wildly with holidays, a provider’s vacation, or a seasonal patient mix, so a rolling quarter gives you a number you can actually trend.
The second is bigger, and it’s the reason a lot of practices think they’re doing better than they are. Search for the accounts receivable formula and you’ll mostly find the corporate finance version: A/R divided by revenue, multiplied by 365. That’s days sales outstanding, and it’s built for companies that bill what they expect to collect.
Medical practices don’t work that way. You bill gross charges and collect a fraction of them. Run the finance formula against net revenue and you’ll get a number that looks noticeably better than reality, then benchmark it against MGMA figures built on gross charges. The comparison is meaningless, and it hides the gap you were trying to measure.
The short version: if the formula you’re using has 365 in it, you’re calculating DSO, not days in A/R. Use gross charges over 90 days instead.
How do you calculate days in A/R?
You need three numbers, all of which your practice management system already has: total A/R as of today, gross charges for the last 90 days, and the number 90. HFMA’s target range for the result is 30 to 40 days.
Here’s a practice with $180,000 in outstanding receivables and $270,000 in gross charges over the last quarter.
| Total accounts receivable | $180,000 |
| Gross charges, last 90 days | $270,000 |
| Average daily charges ($270,000 ÷ 90) | $3,000 |
| Days in A/R ($180,000 ÷ $3,000) | 60 days |
Sixty days. That practice is 24 days behind better performers and 13 days behind the median. In cash terms, every day above the benchmark is another $3,000 of earned revenue sitting outside the practice.
A few practical notes. Pull the same three numbers on the same day each month so your trend line means something. Exclude credit balances from total A/R if your system reports them separately, since they’ll understate the figure. And run the number alongside your aging buckets rather than on its own. A practice at 45 days with a clean age distribution is in better shape than one at 42 days carrying a swollen 90-plus bucket.
What is a good days in A/R benchmark?
Under 35 days puts you with the better performers. HFMA targets 30 to 40 days as healthy, and MGMA’s 2024 data places better-performing practices at 36 days against a 47-day median. Anything past 50 days points to a specific breakdown you can find and fix.
Treat these as ranges rather than a pass-fail line. Surgical practices carrying heavier prior authorization requirements will run differently from primary care. A payer mix weighted toward Medicare Advantage will run differently from one weighted toward traditional Medicare. Your own trend over six months tells you more than any single comparison against a national median.
What about A/R over 120 days? That bucket is where revenue goes to die. Collectability drops sharply with age as timely filing windows close and appeal rights lapse, and a balance sitting untouched at 120 days is often past the point where working it is worth the labor. Better performers hold that bucket to 8.1%.
Why does days in A/R creep up?
Denials are the main culprit. Initial denial rates reached 11.8% in 2024, up from 10.2% a few years earlier, according to Experian Health’s State of Claims report, and more than 41% of providers now report denial rates above 10%. Every denied claim restarts the clock on a balance you already earned.
Payer mix compounds it. Kodiak Solutions’ 2025 revenue cycle analysis found Medicare Advantage plans denying claims at more than double the rate of traditional Medicare, both on initial submission and after appeal. If your Medicare Advantage share has grown over the past few years, your days in A/R almost certainly grew with it, and nothing about your billing process had to change for that to happen.
Three other drivers show up constantly. Front-desk eligibility errors create denials that were entirely avoidable at check-in, which is also why prior authorization workflows deserve more attention than they usually get. Credentialing backlogs park a new provider’s entire revenue stream until the paperwork clears, and a delay there can hold up months of billing. And billing staff turnover leaves worklists untouched, which is the quietest of the three because nothing looks broken until the aging report tells you otherwise.
When a practice comes to us above 55 days, the pattern is usually the same: the 90-plus bucket has been growing for two or three quarters, nobody has worked a denial older than 60 days, and the practice has been watching total collections instead of aging. Collections looked fine because new charges kept flowing in. The old money was quietly aging out the whole time.
How do you reduce days in A/R?
Front-load the work. Verify eligibility before the visit, scrub claims before submission, and work denials within 48 hours. Change Healthcare’s Denials Index found that 86% of denials were potentially avoidable, which means most of what’s inflating your number never had to happen.
The levers that matter map to the revenue cycle in order, and the earliest ones pay the most.
BEFORE THE VISIT
Verify eligibility and secure prior authorizations ahead of the appointment. A denial prevented here costs a phone call. The same denial caught after submission costs a full rework cycle.
AT SUBMISSION
Scrub every claim against payer-specific rules before it goes out. A clean claim rate above 95% keeps the bulk of your A/R in the 0–30 bucket where it belongs.
AFTER A DENIAL
Work denials within 24 to 48 hours, every time. MGMA estimates that 50% to 65% of denied claims are never reworked at all, at an average rework cost of roughly $25 per claim.
THE BACKLOG
Run a dedicated recovery project against the 90-plus bucket rather than folding it into daily work. Old A/R never gets touched when it competes with today’s claims.
EVERY MONTH
Recalculate days in A/R and review your aging distribution on the same day each month. A metric nobody looks at doesn’t change anything.
Across the independent practices we work with, spanning more than 25 specialties, the average reduction in days in A/R is 35% within the first 90 days. Almost none of that comes from chasing old claims harder. It comes from the first two levers, because a claim that goes out clean never enters the aging report in the first place.
That’s also why the number responds faster than most practice owners expect. You’re not collecting your way out of a backlog, you’re stopping the backlog from being created.
Not sure why your number is high?
An RCM improvement audit pinpoints where revenue is stalling in your specific workflow, from front-desk verification through denial follow-up. No upfront fees, no binding contracts.
Frequently asked questions
How do you calculate days in accounts receivable?
Divide total accounts receivable by average daily charges. Average daily charges equals your gross charges over the last 90 days divided by 90. A practice with $180,000 in A/R and $3,000 in average daily charges is at 60 days. HFMA’s target range is 30 to 40 days.
What is a good days in A/R for a medical practice?
Under 35 days puts you among better performers. MGMA’s 2024 Cost and Revenue Survey reports better-performing practices at 36 days against a 47-day median, and HFMA targets 30 to 40 days as healthy. Past 50 days, look for a specific breakdown in claims submission or denial follow-up.
What does A/R over 90 days mean?
It’s the share of your receivables unpaid for more than 90 days. HFMA recommends keeping it under 10% of total A/R. Collectability drops sharply as balances age, since timely filing windows close and appeal rights lapse. Better performers hold A/R beyond 120 days to 8.1%.
What’s the difference between days in A/R and DSO?
Days sales outstanding divides A/R by net revenue and multiplies by 365. Days in A/R uses gross charges over 90 days. Because practices collect only a fraction of billed charges, DSO produces a flattering number that can’t be compared against MGMA or HFMA benchmarks.
How long does it take to lower days in A/R?
Most of the movement comes within a quarter. Practices we work with average a 35% reduction within 90 days, driven mainly by front-end eligibility verification and claim scrubbing rather than collections work. Preventing denials moves the number faster than recovering from them.
The number worth watching
Days in A/R won’t fix a revenue cycle on its own, but it will tell you whether one is working. Calculate it with gross charges, not net revenue. Compare it against 36 days rather than a vague sense of “we collect fine.” Read it alongside your aging buckets, because a healthy headline number can hide a swelling 90-plus balance.
And when the number climbs, look upstream. It’s rarely the collections team. It’s usually a denial that could have been prevented at check-in, a credentialing file that stalled, or a worklist nobody has had time to touch since a biller left.
If your 90-plus bucket has been growing, A/R rescue works the backlog as a dedicated project. If you’re not sure where the leak is, start with an RCM improvement audit. Either way, calculate the number first. You can’t fix what you haven’t measured correctly.